0

I've got an almost completely fresh install of 64-bit Windows 10 on my wife's laptop. It has a Core i5 processor and 4 GB of memory.

If I leave it on for too long, it gets slower and slower. It fills up the RAM and then it fills up the page file. And then it'll show the error:

Your computer has run out of memory.

I'm not confusing "available" with "free" or anything like that. The system is literally out of memory.

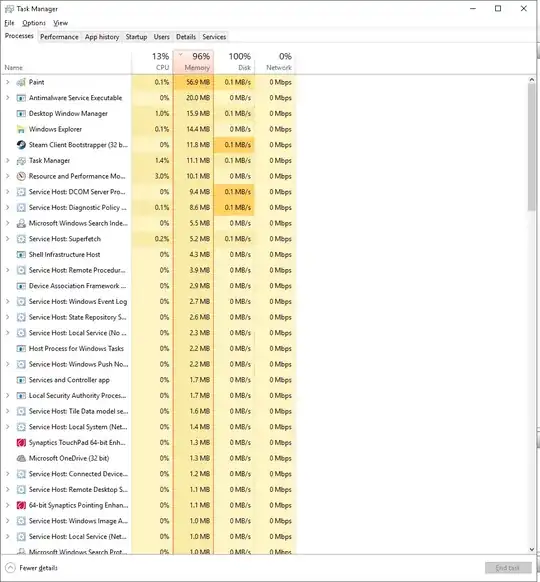
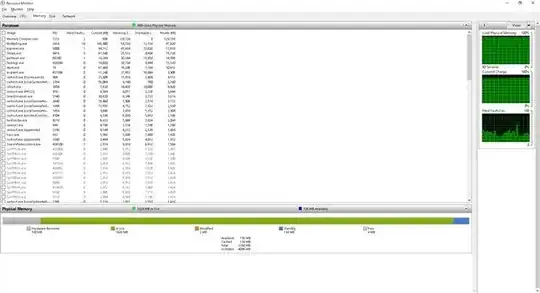
It appears Windows 10 isn't showing all of the processes running on the system. Task Manager and Resource Monitor both report no processes running. But the disk utilization and RAM utilization totals are bright red because they're at 97% RAM and 100% disk. A look at the “Processes” tab shows nothing using more than 10 MB of RAM, and there's only maybe two dozen total background processes, all using no disk.

So I want to know:

  1. Are there processes that Windows hides?
  2. If do, how do I find them?
  3. What's causing my memory problem?

I set the computer to reboot. Five minutes later, it's still trying to close down Task Manager and Resource Monitor. How can this happen? What possible reason could exist for a fresh install of an operating system to have this problem?

Okay, let's look at some pictures.

Task Manager (“Processes” tab)

Resource Monitor

[edit] Nope. Poolmon doesn't show the problem. I'm hitting 4 GB usage again, and poolmon doesn't show it:

Poolmon

[edit] Two more, from the next commenter, running RAMMap:

Notice that "process private" is HUGE (which I have read is memory dedicated to a single process) and yet, no related processes show up in the process list.

RamMAP1

RamMAP1

  • Your system is not running out of physical memory it's running out of virtual memory so increase the size of your page file. – Ramhound Aug 31 '17 at 02:02
  • My down vote was because of the unhelpful rant. If you remove it, and provide information that can be used to help you I will reverse it. Have tried increasing the size of the page file? – Ramhound Aug 31 '17 at 02:06
  • 1
    https://superuser.com/questions/949244/windows-10-high-memory-usage-unknown-reason?rq=1 – Ramhound Aug 31 '17 at 02:08
  • To humor you, I increased the pagefile by 10 GB. Now, how is a idle system with no programs running supposed to fill 4 GB of RAM and then the pagefile? – Katastic Voyage Aug 31 '17 at 02:08
  • The rudeness needs to stop. -1 – studiohack Aug 31 '17 at 02:10
  • I have provided you a link to an answer that should allow you to diagnose your problem. Hopefully you will edit your question to include the information to help you. – Ramhound Aug 31 '17 at 02:13
  • Hey, thank you for the link. I'm installing the WDK. – Katastic Voyage Aug 31 '17 at 02:23
  • If you really appreciate it. Edit your question, improve it, provide us information to help you identify what is happening. You can salvage this question if you do that. It won't happen without you improving this question. – Ramhound Aug 31 '17 at 02:37
  • It sounds like you have a memory leak. One possible option to determine if this is the case is to use Autoruns to disable all 3rd party drivers and other startup items and see if the Commit Charge stops growing so rapidly. Your high Commit Charge indicates something is demanding more memory than you have physical RAM to accommodate, in turn causing your disk usage to hit 100% due to excessive paging. This high disk use is what's making your system so slow. – I say Reinstate Monica Aug 31 '17 at 03:19
  • I also see you have a number of process named `SynTPEnh.exe`, which IIRC is related to a Synaptics touchpad driver. That seems like more processes than normal for that software... – I say Reinstate Monica Aug 31 '17 at 03:27
  • Thanks to the edit Twisty made it allowed me to revert my vote and retract my flag I raised. – Ramhound Aug 31 '17 at 03:33
  • I'm running poolmon per the suggested link. I don't have a immediate answer yet... it takes awhile for a memory leak to fill up. I also have the same Broadcom and Intel RST (?) driver files "BCMWL63a.SYS" and "iaStorAV.sys". as this link here https://www.reddit.com/r/Windows10/comments/3fktdd/how_to_diagnosefix_a_system_memory_leak_in_w10/ by searching \System32\Drivers with findstr /m /s /l ismc *.* NOTICE that the string is ismc, not ECMC from the other thread(s). I don't know if typo or a different situation. – Katastic Voyage Aug 31 '17 at 04:44
  • Another WIP update: This link appears very useful. https://learningintheopen.org/2013/09/18/technical-microsoft-os-memory-tools-poolmon/ they use findstr /m /i /s and you're basically sorting poolmon by bytes with poolmon -b and reading the tag name, and searching for drivers which contain that tag name. And, if the memory leaking driver isn't using the most memory yet, it's not going to be at the top yet so you have to wait longer. I'll let it run overnight and report back. – Katastic Voyage Aug 31 '17 at 04:51
  • Well, this is a continued source of frustration. No indexes show any significant usage in poolmon (115MB max), HOWEVER, the commit is hitting 4 GB. http://i.imgur.com/AgorVt7.png Perhaps it will continue to swell... – Katastic Voyage Sep 02 '17 at 22:09
  • Maybe look over usage with https://docs.microsoft.com/en-us/sysinternals/downloads/rammap — be sure to install all the latest Windows Updates, reboot, and then check what this tool shows. – Vomit IT - Chunky Mess Style Sep 02 '17 at 22:50
  • I will give that a shot. Thank you for the additional options. – Katastic Voyage Sep 03 '17 at 01:36

0 Answers0