0

I have tried to use the steps from this post and similar ones multiple time (Windows 10 high memory usage (unknown reason)) But get no help at all from the results. The WPA parts where all new but almost everything I looked up didnt expand to a bigger stack so I couldnt use that to help much. smNP, ConT, and Even all appear to be windows related and I've tried multiple updates with no change. At one point I thought it was my Video Card drivers but fresh installs of that didnt help. I'm on 64bit Windows 10 1809!

Below is a screenshot of poolmon when my machine starts to crash from low memory. Apologize I realize now this is showing none paged results not Paged.
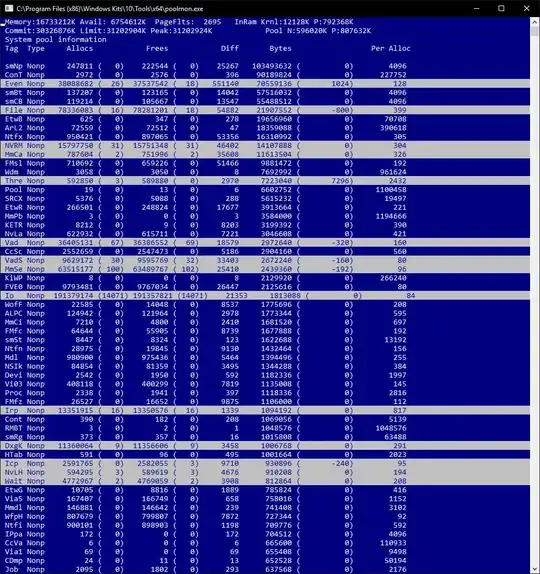
Screenshot of poolmoon

Dracrius
  • 1
  • 1
  • A screenshot of poolmon when my machine starts to crash from low memory. Stack wouldnt let me post it as part on my question!! https://i.stack.imgur.com/0fUCE.png – Dracrius Apr 28 '19 at 13:59
  • Why do you think you have a memory leak? Does it happen when booting in Safe mode? – harrymc Apr 28 '19 at 14:27
  • I have not tried to reproduce it in safe made as it happens over 24hrs+. The machine in question basically runs 24/7 usually without issue prior to windows 10. since upgrading to windows to last December basically once a week I HAVE to restart my machine because VR applications or photoshop will run at a crawl or crash. If I open Task Manager my Ram usages is FAR higher then the math of adding up Processes using RAM. If I check the Paged Pool its been anything from 1.5 gb to 3 gb. Now I'm realizing I should have taken more screenshots before my last reboot and I was looking at Nonpaged – Dracrius Apr 28 '19 at 14:46
  • My machine with Firfox open and basically the same programs as this morning before I restarted use up 6.5 GB of RAM with 484mb Paged pool. I failed to look at all the details before i restarted so i do not know the paged pool size but it was using up 12.6 GB with just Firefox open when Photoshop would refuse to launch and I tried to investigate. – Dracrius Apr 28 '19 at 14:53
  • Well, did you try just quitting Firefox? – Tetsujin Apr 28 '19 at 15:37
  • Haha Yes it doesnt put a dent in the mysterious RAM usage either way. While Firefox does use a lot of RAM I know that and it is always the first thing closed but when 6 GB of RAM arnt being showed as in use by any specific Program I can tell there is a leak somewhere! It was at 10.6 with nothing but windows, Display Fusion (57mb), Avast (about 70mb total) and Asus GPU Tweak (4.6mb) running with Task Manager not showing any other process taking more then 50mb of ram (Oculus VR Server). I've been tracking this for 4 months trying to solve it myself so I've watched all of these pretty closely. – Dracrius Apr 28 '19 at 16:24
  • RAMMAP is a very helpful program to better understand your memory layout, when you believe, this memory leak is happening. – Ramhound Apr 28 '19 at 16:45
  • @Ramhound Thank you I'll download that now as I expect it may happen again soon and I hadn't heard of anything more then poolmon! – Dracrius Apr 28 '19 at 16:56
  • Have you tried terminating Firefox *and waiting?* I’m running Firefox 66.0 on Windows 7, and sometimes my system gets very sluggish, and Task Manager says that Firefox is using a lot of memory.  So I close Firefox (File → Exit) and then watch the process list in Task Manager (and BTW, there are usually at least seven Firefox processes).  It sometimes takes six to eight minutes for Firefox to completely go away. – G-Man Says 'Reinstate Monica' Apr 28 '19 at 18:03
  • @G-Man Oh yes I wouldn't consider Firefox closed until all process are terminated and it is removed from Task Manager in these situations. The Problem is not Firefox. Whatever RAM windows say Firefox is using is freed up apon closing Firefox hence why RAM usage in this mornings instance went for 12.6 to 10.6 by closing Firefox as Firefox was and usually use about 1.7 - 2 GB on my machine (far to many tabs open haha). – Dracrius Apr 28 '19 at 23:20
  • Firefox has in the past had "leaks" related to add-on's this is virtually impossible with the new add-on system but even when it did happen windows would show quite clearly that Firefox was using X amount of RAM. The problem is I can get the Process count to a point where the amount of RAM reported being used does not match what is shown in the Performance Tab where I can see the memory at that time sitting at 10+ GB with basically nothing open (but Avast, I even kill Display Fusion if something hasn't crashes it by this point) – Dracrius Apr 29 '19 at 02:04

0 Answers0