19

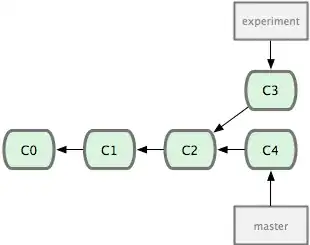
The diagrams in the Git Community Book are excellent and I'd like to know what software was used to create them. I emailed the author, but he didn't respond, so does anyone else know?

(This question was raised by request within this stackoverflow answer).

enter image description here

trojanfoe
  • 375
  • 2
  • 14
  • 1
    My guess would be [Graphviz](http://www.graphviz.org), and/or [OmniGraffle](http://www.omnigroup.com/products/omnigraffle/features/). – sblair May 20 '11 at 14:46
  • 1
    I'd have said OmniGraffle too. At least judging from the arrows and rounded corners. – slhck May 20 '11 at 15:16
  • Cheers guys - I guess we'll never know for sure unless the Author makes a visit to this site (which is possible). – trojanfoe May 20 '11 at 15:18
  • 2
    The file extension **.graffle** [here](https://github.com/progit/progit/tree/master/figures-source) is suspicious... It seems Omnigraffle. – microspino Oct 10 '13 at 07:38

1 Answers1

1

yEd is a powerful and free graph editor that produces really nice graphs.

I use it often for my needs. It provides automatic layout and many shape / line options.

These graphs could have been produced by this program.

Raphael Jolivet
  • 637
  • 1
  • 5
  • 12
  • 3
    They did not ask a generic software-recommendation question (which would be closed anyway since it has been asked numerous times already); they were asking about the *specific* program that was used to make the Git diagrams, and comparing the [graphs](http://www.yworks.com/en/products_yed_gallery.html), it does not look like yEd was used. – Synetech Nov 23 '12 at 03:08