22

I've got a value associated to each day, as such:

120530    70.1
120531    69.0
120601    69.2
120602    69.5
# and so on for 200 lines

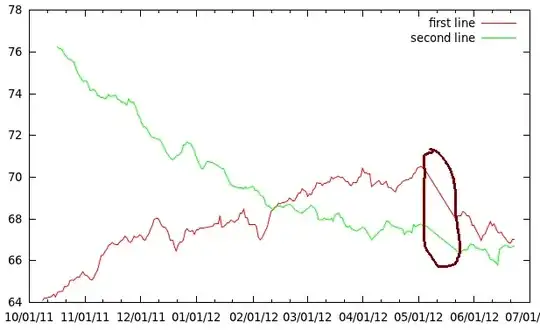
When plotting this data in gnuplot with lines, the data points are nicely connected. Unfortunately, at places over a week of data points can be missing. Gnuplot draws long lines over these intervals. How can I make gnuplot only connect points on consecutive days?

Solutions that require preprocessing of the data are fine, as I already smooth it with a script.

Here is what I use:

set xdata time
set timefmt "%y%m%d"
plot "vikt_ma.txt" using 1:2 with lines title "first line", \\
     ""            using 1:3 with lines title "second line"

Example: gnuplot example

Baarn
  • 6,624
  • 6
  • 35
  • 64
Anna
  • 263
  • 1
  • 2
  • 5
  • Here is a picture of the problem: http://i.stack.imgur.com/aYH4N.png (can't add images to the post for some reason). I want the circled area to be left blank. – Anna Jun 24 '12 at 15:05
  • Welcome to superuser. You can't because you just have not yet gathered enough reputation on this site. If you are unhappy with my changes you can of course revert them (or edit again). – Baarn Jun 24 '12 at 15:09

4 Answers4

18

Put an empty record (blank line) where there is no data. From the docs:

Single blank records designate discontinuities in a plot; no line will join points separated by a blank records (if they are plotted with a line style).

Thor
  • 6,419
  • 1
  • 36
  • 42
Keith
  • 8,013
  • 1
  • 31
  • 34
11

You can use any string that is not a number as value for the missing data points or explicitly specify a missing data string using the set datafile missing command.

If you then plot the lines using

plot "vikt_ma.txt" using 1:($2) with lines title "first line"

then Gnuplot will leave a gap.

Roland W
  • 281
  • 2
  • 6
  • This doesn't work. It will still connect the lines. It will just skip the marker for `linespoints` and connect straight through them, even for `lines`. gnuplot 5.2 patchlevel 8 on windows. – jbx Aug 24 '20 at 14:27
2

You can also do something like this to automatically create gaps when the distance between x values exceeds some threshold:

previous=1
current=1
shift(x) = (previous=current, current=x)
yornothing(x,y) = ( shift(x), abs(x-previous)<7200?y:sqrt(0/0))

plot "file.dat" using 1:(yornothing($1,$2)) with lines

You'll need to adjust the initial values of "previous" and "current", and the threshold ("7200" in the example above).

The function "yornothing" uses the function "shift" to store one previous value of x. Each time yornothing is called, it returns either the value of y or "0/0", depending on whether the absolute value of the difference between x and its previous value exceeds the threshold.

A value of 0/0 tells gnuplot to ignore that point.

Bryan Wright
  • 141
  • 4
0

Hej!

Your post is already older but I have a similar problem. I'm using time data though as the input (following format: 2022-08-01,00:03:03) which is imported with the following settings:

   set xdata time
   set timefmt '%Y-%m-%d,%H:%M:%S'
   set format x "%H:%M"

I'd like to skip lines if the spacing is more than, say, 15 minutes between timestamps. How can the yornothing-function be adapted to work with time in the above way?

Thanks, help appreciated!

JaJo

JaJo
  • 1
  • 2
    As it’s currently written, your answer is unclear. Please [edit] to add additional details that will help others understand how this addresses the question asked. You can find more information on how to write good answers [in the help center](/help/how-to-answer). – Community Oct 14 '22 at 16:49