2

I need to get data from a pretty simple yet not really common type of plot (graph). If you take a look at this image, you will notice that the Y axis is irrelevant and that curve has to take its place.

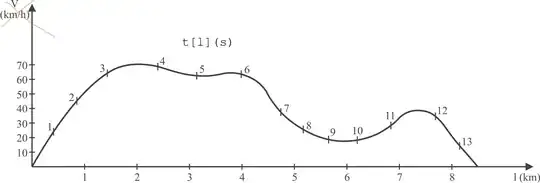
The actual data I need is for each 'X'(l) read value of t(l).

I've already tried UN-SCAN-IT, Engauge, Digitizeit etc. and none of them seems to support curves as an axis – or maybe I'm going about this issue the wrong way.

niton
  • 1,796
  • 14
  • 21
vitalic
  • 21
  • 2
  • Ok, didnt seem that way at first, so far 6 programs were tested by me and non seem to produce any results thats why I posted similar question. – vitalic May 18 '13 at 14:40
  • I can not understand what you are trying to do! What do you mean by t[1]? You have a graph in which, the horizontal axis represents the distance travelled, in KM, and the vertical axis shows the speed, in KM/h. The curve gives you different speeds at different travelled distances. – Ali May 19 '13 at 01:13
  • 1
    Its not like that, curve gives time in seconds needed for travel, I had some progress with Dagra, I will post answer when Im satisfied with results (main thing I need here is how much is for example t(1,1) on X axis. While reading 1 2 3 4 ... 13 is easy values in-between are not. – vitalic May 19 '13 at 10:18

0 Answers0